
Difficulties with F1 score as a benchmark for accuracy.
F1 score is an equivocal measure of accuracy, because it assigns equal importance to recall and precision. A participant who attained 95% recall and 50% precision on privilege (an excellent performance) would rank behind a participant with 60% recall and 80% precision (abysmal). (Click here for a simple F1/F2 calculator). Clients generally value recall more than precision (because failure to produce a responsive document or to withhold a privileged one is considerably more likely to cause problems than the opposite, and because precision can readily be boosted by reviewing the recall set). F1 score may be a decent proxy for accuracy, but less informative compared to, say, F2 score (which double-weights recall), or to precision at a target recall level. This is especially so with respect to privilege, where TAR clients typically place a far greater premium on recall than precision.
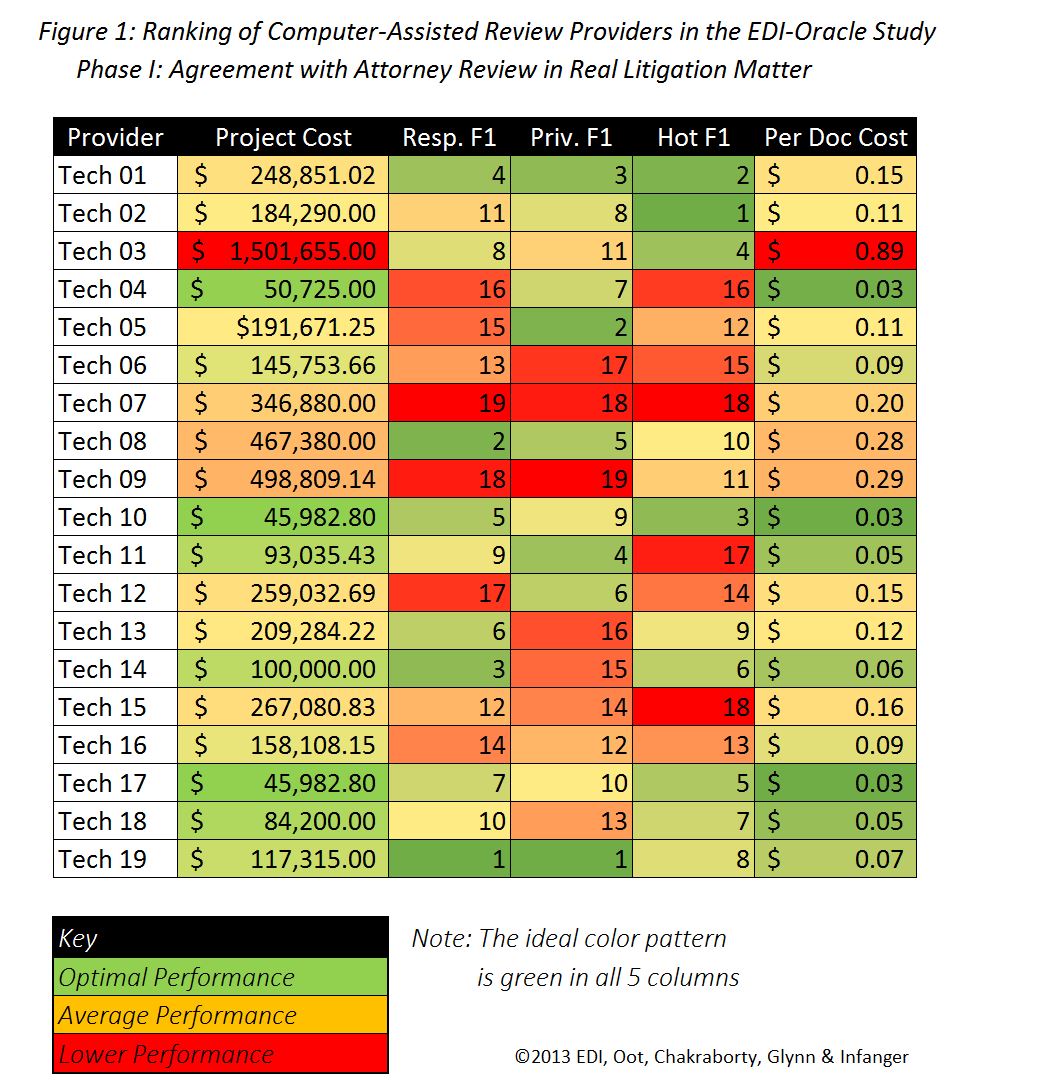
Difficulties with ordinal rankings.
The lack of raw scores precludes any evaluation of which teams performed well in the sense of generating accuracy levels which would be useful in a case. In addition, ordinal rankings give no sense of magnitude of the difference in F1 scores, preventing a determination of how much better or worse a given entry was compared to the others. If all 19 entries had F1 scores within 5% of one another, for example, this would show a fairly trivial difference in performance (especially given the magnitude of difference in cost). If the 19th-place entry had an F1 score that was 50% lower than the 18-place entry, but the 18th-place entry was within 10% of the first-place entry, that would tell us that the 19th-place entry was much worse than the others but the others were tightly clustered together. We currently lack any sense of the magnitude of difference between the various entries. Thus further complicates any cost-adjusted performance assessment, as discussed below.
Bang for the buck: a first crack at cost-adjusted performance
An longstanding conundrum of TAR evaluation is how to control for investment of resources, a dual-faceted problem. The first issue is how to measure the resources (time, effort, technology expense, all readily translatable into money) a given entry would have consumed. A well-known (now defunct) evaluation, TREC Legal Track, sought to address this concern through metering of subject-matter expert (SME) usage and self-reporting. The EDI - Oracle study equalized SME usage by limiting interaction to two conference calls open to all, and required participants to submit invoices with total project cost, which invoices formed the basis for the reported project cost figures.
The second, more difficult issue is how to measure value per dollar where study participants invested different amounts of resources and generated different levels of accuracy. If everyone attained the same level of accuracy, it would be readily apparent which product yielded the best monetary return on investment. If everyone charged the same cost, it would be readily apparent (with caveats not important to discuss here) which product yielded the best return in accuracy (however measured) for a given investment. When vendors present different levels of accuracy and cost, however, how to measure the amount of accuracy (in increased recall, for example) that an additional dollar would buy?
Note that this is an additional complication of using F1 score as the accuracy lodestar. A cost-effectiveness comparison would have been possible had the study set a specific accuracy goal. That would present some pitfalls, too, but perhaps more readily overcome (e.g., choosing a goal not so lenient as to obscure the effectiveness of different approaches to difficult problems but not so stringent as to trigger unrealistically high costs or render participation infeasible, obscuring vendors' ability to offer trade-offs between recall and precision, failure to measure marginal cost of additional accuracy).
A simplistic way to compare submissions with discrepant levels of cost and accuracy is to divide cost by unit of accuracy (e.g., dollars per F1 score). That measure has imperfections, some stemming from the rapidly diminishing returns to TAR training. The marginal cost of an additional unit of accuracy is typically much higher than the average cost. Thus, a low-accuracy team incapable of generating acceptable accuracy levels could nevertheless yield a high return on a trivial investment of resources. Similarly, a high-cost, high-accuracy team might have shaved significant costs by stopping at a lower level of accuracy.
The lack of F1, recall, and precision scores underlying the ordinal rankings provided by EDI, leaves us with no unit of accuracy by which to divide cost. We can fabricate one by translating ordinal rankings into F1 percentiles (such that the highest-ranking F1 team is at the 100th percentile, and descending in percentile increments of 5.3% (1/19) for each rank). Of course, as noted above, we really don't know how great the difference is between teams for a given tag. This technique could understate or (more likely) overstate the difference between teams.
Nevertheless, this is all we have available pending the release of actual figures. So, for whatever it's worth, below is a sortable table based on the ordinal F1 data provided by EDI. For each tag, I have translated the F1 rank into a percentile, and calculated a price per accuracy (F1) percentile. To the right of the table I've also compiled average rankings with each of the three tags weighted equally. I've used the same three-color scale that EDI used in its spreadsheet. You can download the spreadsheet by clicking on the Excel button beneath it.
To see which teams offered the most bang for the buck--the most accuracy per dollar--sort by ascending cost per percentile for a tag (or for overall average). To see which teams achieved the best F1 for a given tag (or overall average), sort by ascending rank (or descending percentile).
The table reveals no correlation between accuracy and expense. The more expensive entrants did not demonstrate consistently superior accuracy, and some of the economical entrants returned consistently high-ranking results. Below I have graphed per-document cost vs. accuracy (F1) percentile across all tags. A correlation between cost and accuracy would show data points following a generally upward-sloping line. Instead, the plot is flat, with some expensive outliers.
 percentile")
Curtailed review guidance may lead to disappointing results
As alluded to above, providers had necessarily limited interaction with the subject-matter expert. Teams received some general written guidance, and were able to submit questions which were addressed during two group conference calls open to all participants. These constraints, very understandable given the nature of the study, meant that teams enjoyed little guidance on review criteria compared to the typical case in which review attorneys have almost constant and immediate access to the SME. This is particularly important for tags with higher subjectivity or lower prevalence. For example, some firms treat all blank contracts as presumptively privileged, others do not. Such documents can constitute a significant proportion of potentially privileged documents. Getting on the right side of these blurry but exacting lines can make or break the quality of a production in some circumstances, especially when the documents are not coded in a manner calibated to degree of responsiveness. I therefore predict that, in the final analysis, we will see levels of recall and precision which are facially disappointing and lower than what one would expect in a real case.
Oddment & the end
I am curious as to why EDI released only ordinal rankings, and only F1. Presumably EDI has the recall and precision figures needed to compute the F1 scores which must have been used to determine the ordinal F1 rankings. It would be interesting to learn the rationale for withholding them. They could be preliminary and subject to change, but then so would be the F1 rankings which were released. If anyone knows the reason for the delay, please share. We look forward to delving into additional data as it becomes available.
No comments:
Post a Comment